A stock that's been in the news lately has been Mosaic, Co. (MOS). Every time I hear how hard it is falling I want to keep bouncing my head off of the desk. The following is a review of a trade that could have turned out to be one my best of the year when factoring the analysis & trade...but not the exit.
Research:
9/21 - Looking for an options play on a stock with earnings coming up I noticed $MOS, a rather volatile stock had earnings on 9/28. Looking at my volatility chart I saw an opportunity right away.
Key Points:
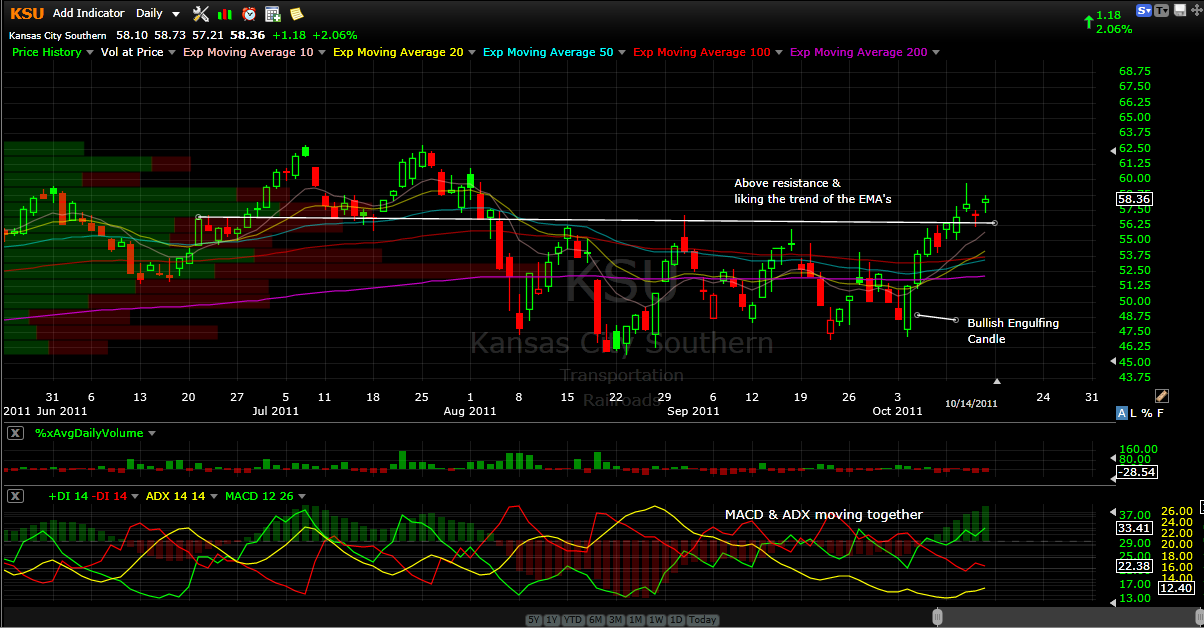
1) See notes on the chart as this is what I noticed. A stock that could move big was consolidating, coupled with low volatility relative to the past.
The Trade and Reason:
- Buy the October 70 Straddle priced at 6.90 or better
- Chart could break either way & notes on chart all factor in
- News & Factors in near future
- 9/28 - Earnings release
- 9/29 - Economic Report of Farm Prices
- Rising Dollar causing pressure on commodities, ie. Corn
- These factors made me choose the Straddle for the fact that the chart said it could go either way, Implied Volatility was relatively low to recent moves, and the impending news events would keep Implied Volatility at bay and keep Theta decay at minimum.
Trade Fill
At left is the Risk Graph of the trade that was filled at 6.87 (just below my max allocation).
The Exit
- My goal going into this trade and with most Staddles/Strangles I play, was around 20-30%. Current market conditions were volatile and quick & big gains could turn into breakevens or losses quickly. So in setting my technical targets, this put the trade hitting my percentage return goal.
- In 2 days my targets were approaching, this happened quicker than thought & thinking it could see a quick reversal I was looking to exit as I was at the lower end of my goal. You can see the notes in where legged out of this.
- From my exit forward, I got out at the worst time as this was in for a wild ride.
Action After Exit
- Disappointing earnings miss coupled with poor economic report related to corn caused a swift drop.
- The subsequent drop I missed making the Oct 70 Straddle very profitable & great strategy.
- Risk Graph showing the date 10/01. While I cashed out at +$129 on $687 risk, the trade is currently priced at 21.10 (+$1423 / +207%).
Some Thoughts:
- Hard to get mad as I exited at points where I determined I should exit.
- At the same time, I shouldn't be so quick at scaling down to a lower timeframe but should have let this play out some more, accepting a breakeven if reached as I got out at the highest retracement.
- I only traded one contract due to current risk allocation but this is where multiple contracts comes as an advantage as a trader could have scaled out one contract leaving one on still.
Current Adjustment Considerations:
Below are two adjustment I would consider if still in this trade. Basically I want to reduce my short deltas.
**Simple Strategy: Sell an ITM Put creating the risk graph at left. Set a point above current price on the chart and exit if that point is hit.
Here I am
selling the Oct 52.5 Put (ability to achieve around another $150 in profit)and would look to exit if 52.50 was hit on the chart. The more aggressive you wanted to get to the short side, the lower the Put you would sell.
**My Favored Strategy:
Create a 15pt wide Butterfly.
Sell 2 Oct 55 Puts and Buy 1 Oct 40 Put for a credit of 13.83. This is my favored trade as it corners a profit. At expiration the following happens:
- Lowest gain is around $695-700 (price below 40 or pinned at 70.
- Max gain at peak of morphed Butterfly is $2195. (And beyond 85, unlikely)
- Between 45 and 65 (my technical bail points) is $1200 at 45 and $1700 at 60.
Conclusion:
The factors and research leading to this trading created a favored trade in my opinion. This trade did move beyond my expectations and looking at it now its hard to see the profits left on the table. At the same time a trader has to be satisfied that they took the collaborated factors and created a successful setup and executed it.
Now the exit strategy just needs to be modified.


 There is never a guaranteed trade and you can never be an expert in all fields. What you can do is collect the data or opinions of experts in those fields and try to stack your deck with as many cards as you can. Who knows further data from the Association of American Railroads may come out showing a decline and the charts may also deteriorate as well but I wanted to show how a trader can take as many factors as possible (expert opinion combined w/economic reports, technical & fundamental analysis, leveraged bets by institutions) and try to put the odds on your side.


